
Plot SPT and laboratory charts
Plot SPT N, N60 and (N1)60 against depth or RL, point load, plasticity and particle size charts across the holes of a project in GeotechOS Borehole Logging.
Applies toWindows and macOSWeb browser
Charts show the test results of all the holes in a project together. For example, plot SPT N against depth for each hole, and add a design line. The charts use the rows that you logged and the laboratory results that are approved.
Open the charts
- In the project tree, click the project.
- Click Data › Charts.
- In the list at the top left, select the chart.
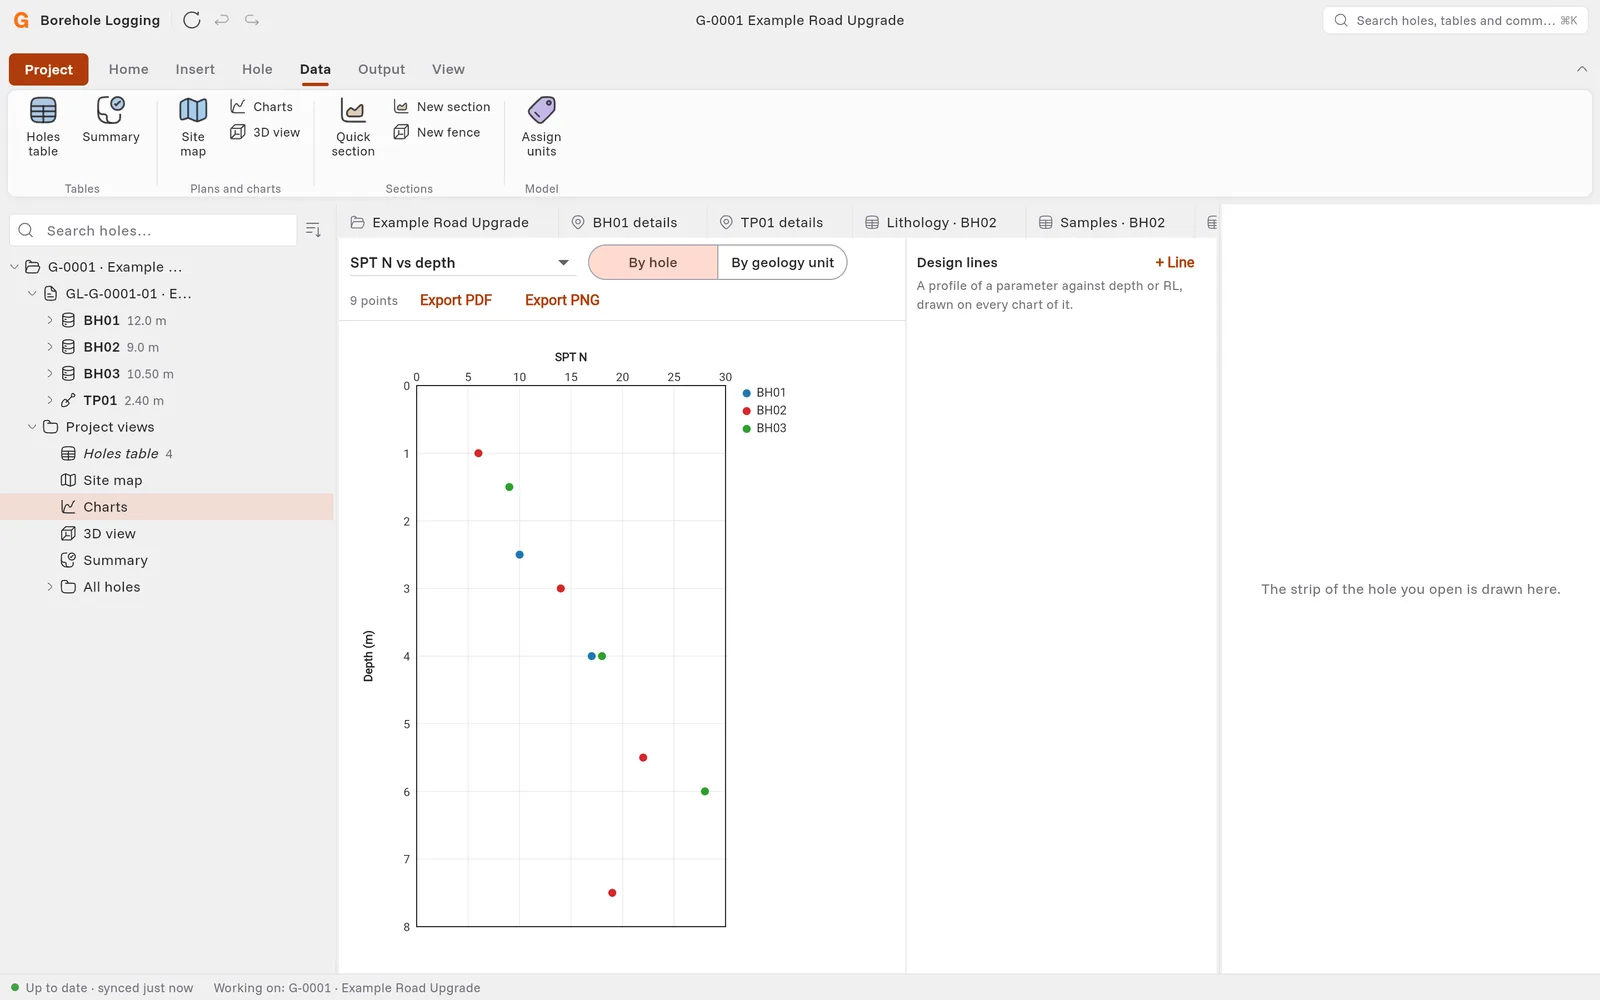
The charts
| Chart | What it shows |
|---|---|
| SPT N vs depth, SPT N vs RL | The SPT N value of each test. For RL, the hole must have a ground level. |
| SPT N60 vs depth | N corrected for energy, hole diameter, sampler and rod length. If no energy ratio is recorded, Borehole Logging uses 60 %. |
| SPT (N1)60 vs depth | N60 corrected for the overburden pressure. Set the unit weights in the project's Log options. |
| SPT N histogram | How many tests have each N value. |
| Point load Is50 vs depth, Point load Is50 histogram | The point load index results. |
| Moisture, PL and LL vs depth | Laboratory moisture content and Atterberg limits. |
| Plasticity chart | Plasticity index against liquid limit, with the A-line and the U-line. |
| UCS histogram | Laboratory uniaxial compressive strength results. |
| Particle size distribution | Laboratory grading curves. |
Refusals are not plotted, because their N is not a full count. An SPT with N only, for example from an AGS file, is plotted on its N.
Group the results
Click By hole to show each hole in a different colour. Click By geology unit to show each unit in a different colour. A test takes the unit of the stratum at its depth.
Laboratory charts
The laboratory charts use the results that the laboratory approved. Your computer must be online to get them. To get new results, click Refresh lab values. See Send samples to the laboratory.
Add a design line
A design line is a profile, for example a design SPT N against depth. It shows on each chart of its parameter in the project.
- Under Design lines, click + Line.
- Type the Name, and select the Parameter.
- In Against, select Depth (m) or RL (m).
- Optional: type a Colour, for example #C0392B.
- In Nodes, type one point on each line: the depth (or RL), a comma, then the value. For example, 0, 5 then 6, 20.
- Click Save.
Save a chart
- Click Export PNG to save the chart as an image.
- Click Export PDF. In Title block, type the details for the sheet, then click Export.