
The desktop workspace
Find your way around the Borehole Logging desktop workspace: the ribbon, the project tree, document tabs, the strip, Checks and the status bar.
Applies toWindows and macOSWeb browser
The desktop workspace is Borehole Logging on a computer or in a web browser. This page tells you the name of each part, so that you can follow the other guides.
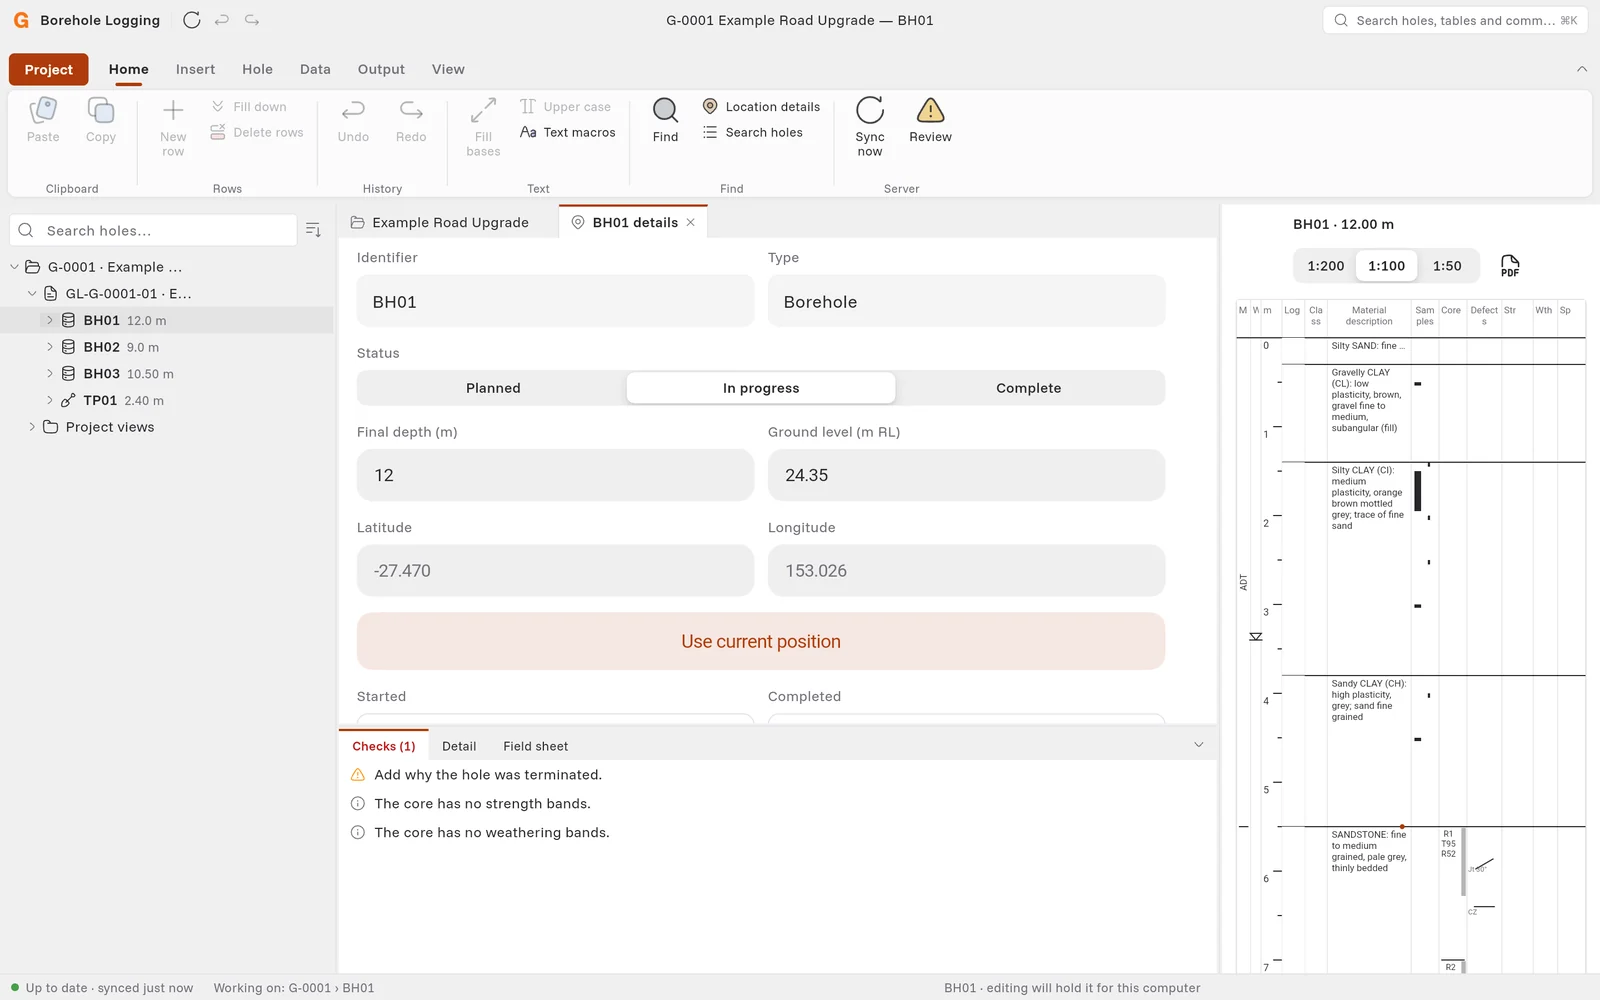
The parts of the workspace
| Part | Where | What it does |
|---|---|---|
| Ribbon | Top | The commands, in tabs. |
| Search box | Top right | Finds a hole, a table or a command. Press Ctrl+K (⌘+K on a Mac). |
| Project tree | Left | Your projects, investigations and holes. |
| Document area | Middle | The tables and pages that you open, each in a tab. |
| Strip | Right | A live log of the open hole. It changes while you type. |
| Bottom panel | Below the document area | Checks, Detail and Field sheet for the open hole. |
| Status bar | Bottom | The sync status, the project you work on, and the hole that your device holds. |
The ribbon
Click a tab name to show its commands. The commands that you cannot use now are grey.
| Tab | What you find there |
|---|---|
| Project | The project page: information about the open project, a new project, open a project, options, and Sign out. |
| Home | Copy and paste, add and delete rows, undo and redo, text tools, find, and Sync now. |
| Insert | Add a borehole, a test pit or an investigation. Read field sheets, survey photos, add a DCP test, and import files. |
| Hole | Commands for the open hole: checks, the field sheet, replicate, fracture spacing, downhole survey, send samples to the laboratory. |
| Data | The holes table, the project summary, the site map, charts, the 3D view, sections and fence diagrams. |
| Output | Log sheets and PDF files. Export to Excel, KML and AGS 4. |
| View | Show or hide the panes, collapse the ribbon, set the theme, and sign out. |
Some tabs show only when you need them. For example, the Table Tools tab shows when the holes table is open.
Tip: To make more space, collapse the ribbon. Press Ctrl+F1 (⌘+F1 on a Mac), or click the arrow at the right of the tabs.
The project tree
The tree shows each project, then its investigations, then its holes. A number after a hole is its final depth.
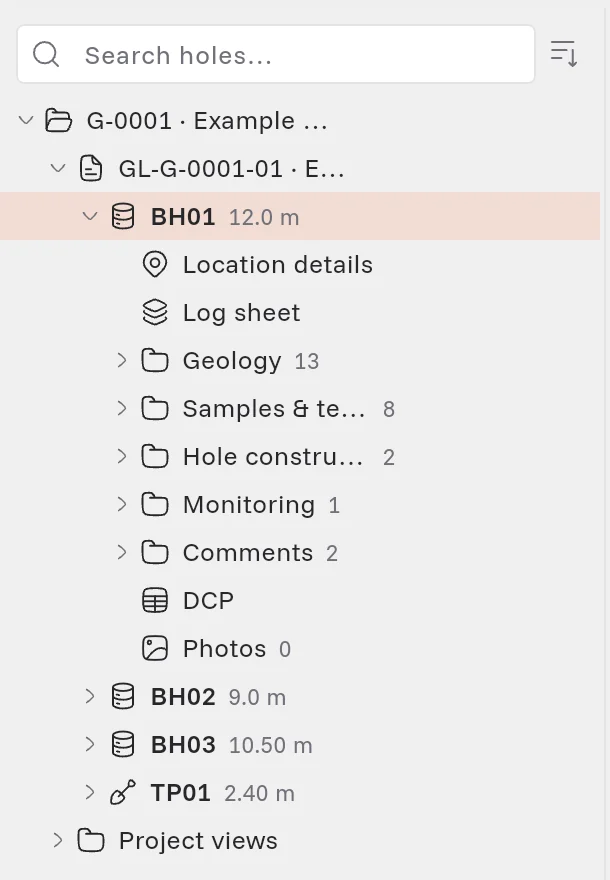
- Click the arrow next to an item to show what is in it.
- Under a hole, you find Location details, Log sheet, and its tables in groups: Geology, Samples & tests, Hole construction, Monitoring and Comments. The number after a group is the number of rows.
- Under Project views, you find the holes table, the site map, charts, the 3D view and the project summary.
- To find a hole, type its identifier in Search holes at the top of the tree.
Tabs in the document area
When you click an item in the tree, Borehole Logging opens it in a preview tab. The tab name is in italics. The next item that you click replaces the preview.
To keep a tab open, double-click the item in the tree, or start to edit in the tab. To close a tab, click the × on the tab, or press Ctrl+W.
The strip
The strip shows the open hole as a log: the depth, the material description, the samples, the core and the defects. Click 1:200, 1:100 or 1:50 to change the scale. Click PDF to make a PDF of the log sheet.
To show or hide the strip, click View › Strip.
The bottom panel
- Checks lists what is missing or wrong in the open hole. Fix these before you print the log. See Check the log.
- Detail shows all the fields of the row that you selected.
- Field sheet shows the scanned field log for the hole, if there is one.
To show or hide the panel, click View › Bottom panel.
The status bar

The left side shows the sync status, for example Up to date · synced just now. The middle shows the project or hole that you work on. When you edit a hole, the right side shows that your device holds that hole. See Work offline and sync.