
Show the holes on a site map
Show the holes of a project on a plan in GeotechOS Borehole Logging, with contours, a basemap or site plan, alignments, surfaces and CAD drawings.
Applies toWindows and macOSWeb browser
The site map shows the holes of a project on a plan, at their easting and northing. It can draw contours of a value that the holes measured, for example the ground level or the depth to groundwater. You can put a basemap, a site plan or a CAD drawing under the holes.
Before you start
- Give the holes their easting and northing. See The hole details, or type them in the Holes table.
- For a basemap, set the coordinate system of the investigation with its zone, for example MGA2020 Zone 56. Do this on the project page, in Project details. A coordinate system with no zone, for example GDA2020 / MGA, cannot place a basemap.
Open the site map
- In the project tree, click the project.
- Click Data › Site map.
The site map opens in a new tab. It also shows under Project views in the project tree.
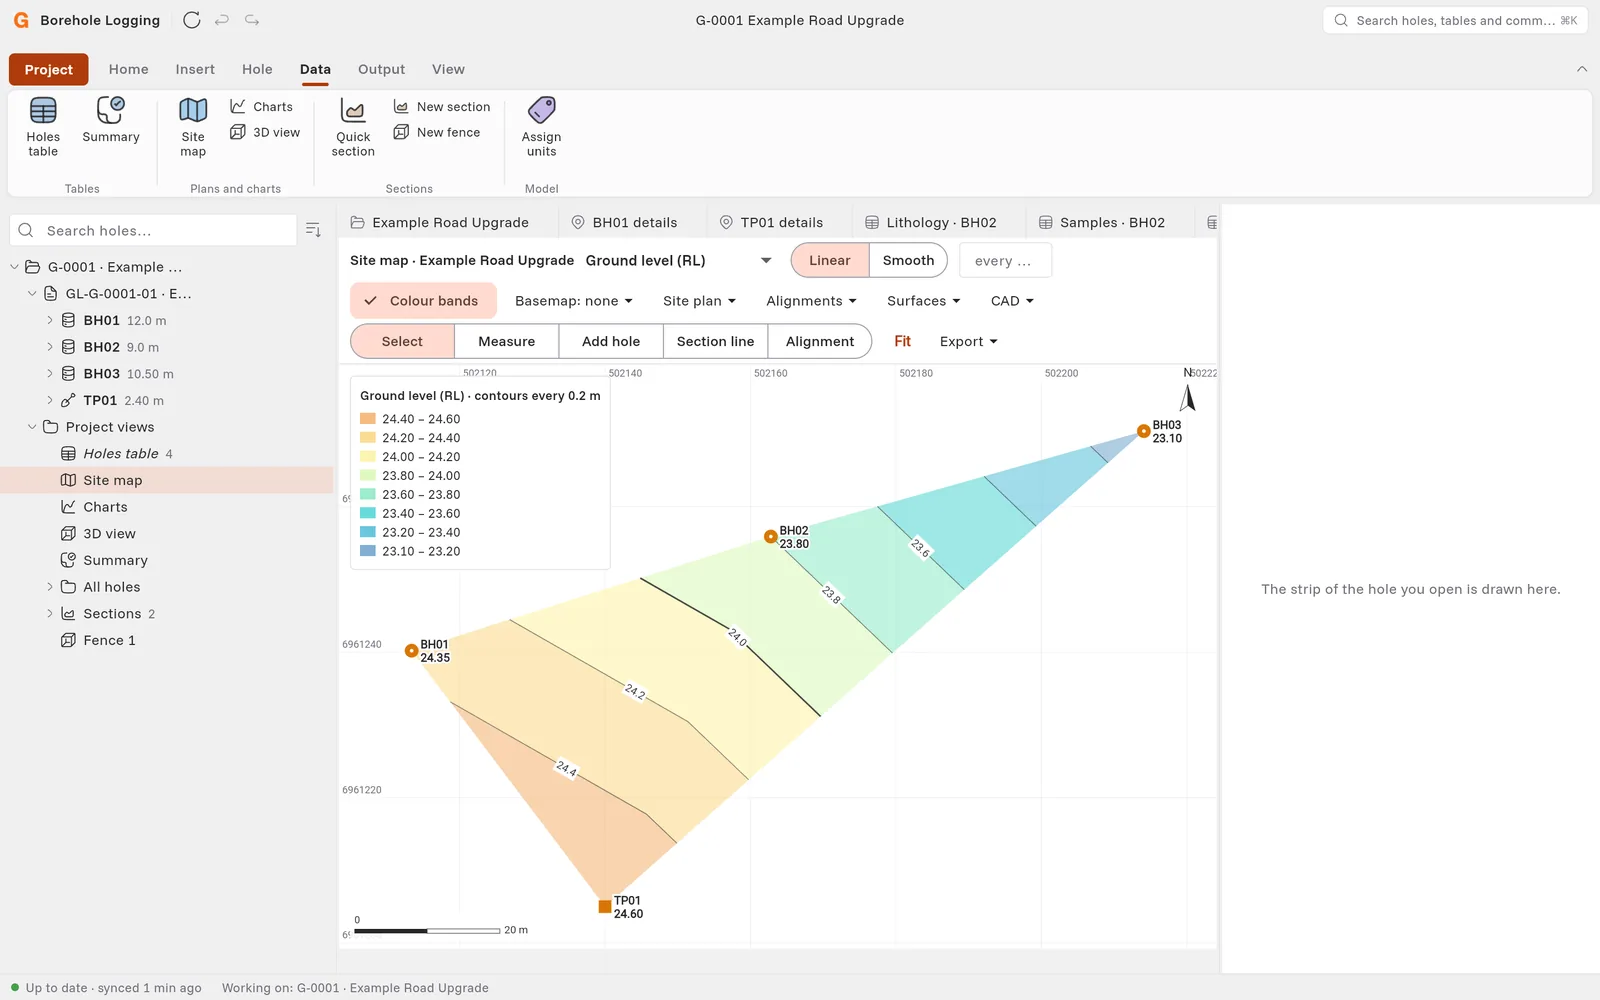
Show contours
- In the first list on the toolbar, select what to contour, for example Ground level (RL) or Depth to groundwater.
- For a legend, for example Top of a legend (RL), select the legend in the next list.
- Select Linear or Smooth:
- Linear draws straight between the holes. It does not draw past the outer holes.
- Smooth draws rounder contours, a little past the outer holes.
- Optional: in the interval field, type the contour interval, for example 0.5.
- Optional: click Colour bands to fill between the contours with colours.
The key at the top left shows the colour of each band. The status bar shows the holes that have no coordinates or no value.
Put a map or a drawing under the holes
| Menu | What you can do |
|---|---|
| Basemap | Select Aerial to show an aerial photo under the holes, or Streets or Dark for a street map. The basemap needs an internet connection. |
| Site plan | Add a plan or an aerial photo with a world file. Or click Place by two points… to place it by two points that you know. Set the Opacity, or click Remove site plan. |
| CAD | Click Import CAD drawing (DXF)…. Click Layers of the drawing to show or hide its layers. |
Use the tools
The second row of the toolbar has the tools:
- Select: click a hole to select it. Then click Details or Log sheet to open it.
- Measure: click points on the map. The status bar shows the length and the area. Press Esc to clear the points.
- Add hole: click the map. Borehole Logging opens the Holes table with a new row at that easting and northing. Type the identifier and the depth.
- Section line: click along the line of a section, then press Enter. Borehole Logging asks for the name and makes the section. See Draw sections and fences.
- Alignment: click along a road or pipeline centreline, in the direction that the chainage increases. Press Enter to finish.
Alignments and surfaces
- Alignments: click Import alignment (LandXML, CSV, Excel)… or Draw an alignment on the map. An alignment gives each hole a chainage and an offset.
- Surfaces: click Import surface (LandXML, XYZ, CSV)… to add a ground or design surface. The surface stays with the project.
Set the RL of the holes from a surface
- Import the ground surface.
- Click Surfaces › Set hole RLs from a surface….
- Look at the table. It shows RL now, the Surface level at the collar and the Difference for each hole. Borehole Logging ticks the holes that have no RL, or an RL far from the surface.
- Tick or clear the holes. Click Tick all or None to change all of them.
- Click Set 3 RLs. The button shows the number of holes that you ticked.
To put the old RLs back, click Undo in the message at the bottom of the window.
You can also do this in the Holes table: click Holes table › Set RL from surface.
Save the map
Click Export, then Image (PNG)… or A3 sheet (PDF)…. Borehole Logging saves the map as it shows.