
Describe the soil and rock
Enter the lithology of a borehole in Borehole Logging. Set each layer's depth, graphic, group symbol and AS 1726 description, and build descriptions from parts.
Applies toWindows and macOSWeb browser
The Lithology table holds the layers of soil and rock in a hole. The log sheet prints them in the graphic log, the group symbol and the material description columns.
Before you start
Read Use the tables. It tells you how to type, paste and save in a table.
Add a layer
- Open the hole's Lithology table. It is in the Geology group.
- In the empty row, type the Top and the Base in metres.
- In Graphic, select the symbol for the material. See Select the graphic.
- In Group symbol, type the symbol to AS 1726-2017, for example CI or SC. For rock, type a short code, for example SST for sandstone.
- In Description, type the description, or build it from parts. See Build a description from parts.
- Press Enter to go to the next row. The app saves the row.
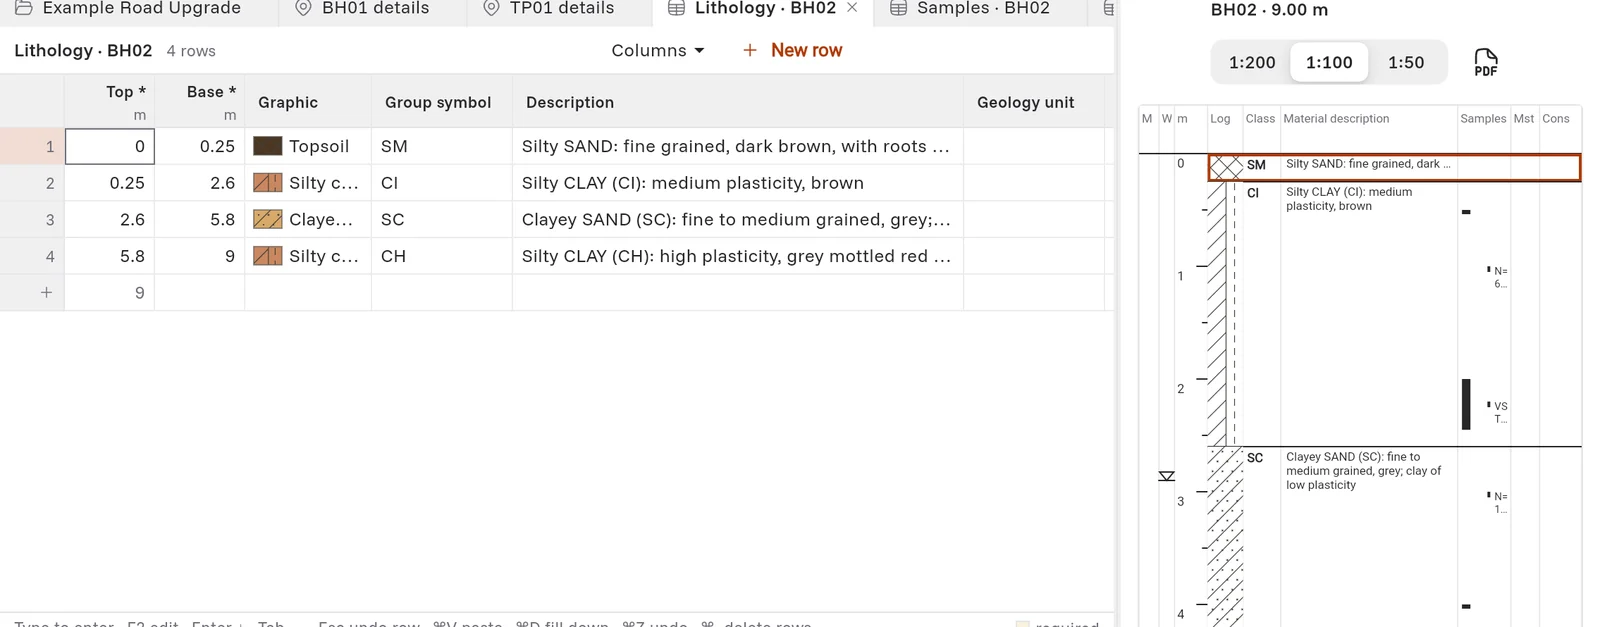
The strip on the right changes while you type, so you can see the log.
Select the graphic
The graphic is the symbol that the log sheet draws for the layer, for example Silty clay or Sandstone.
- Type the start of the name, then press Enter to take the suggestion.
- To see all the symbols, press F4 or Alt+↓, or click the colour square in the cell. Select a symbol.
The symbols come from your workspace. To change them, click Project › Material Symbols.
Build a description from parts
You can type the full description, for example Silty CLAY (CI): medium plasticity, orange brown. You can also fill in the parts, and the app writes the description in AS 1726 order.
- Select the layer in the table.
- In the bottom panel, click Description.
- Fill in the parts: the Qualifier and Soil, the Plasticity or Grading, the Colour, then the other parts. Each part has a list. Press F2 in a part to open its list.
- Read the description at the top of the panel. It changes while you type.
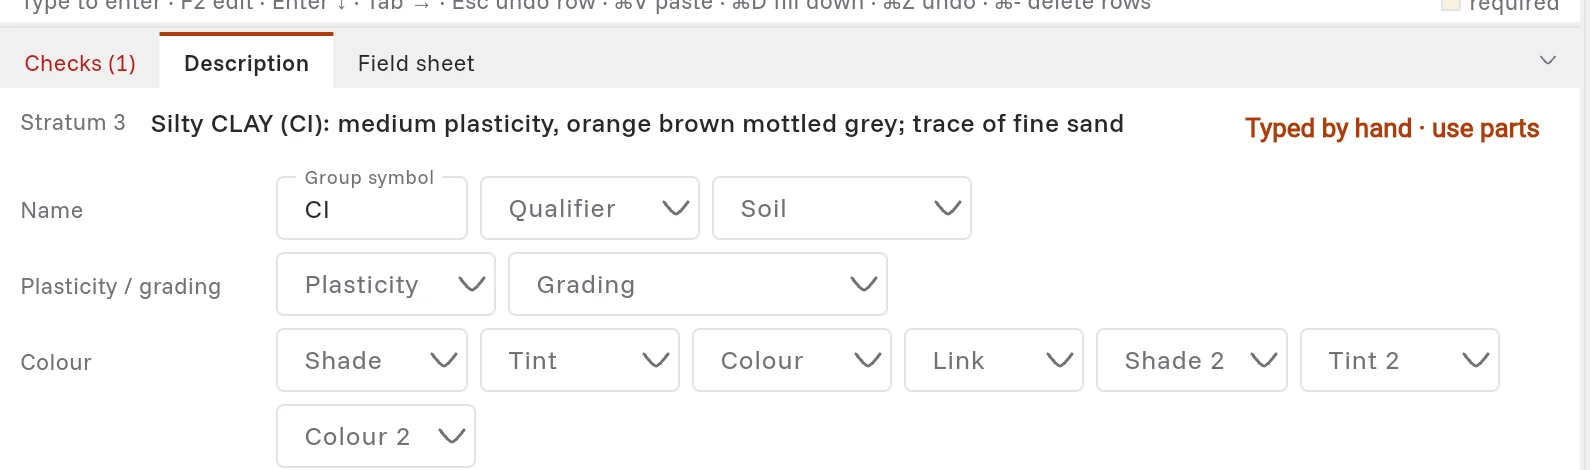
Note: When you type the description yourself, the app keeps your text. A change to a part does not write over it. The panel shows Typed by hand · use parts. To let the parts write the description again, click Typed by hand · use parts.
The Description panel does not include the moisture and the consistency. Record them in their own tables, because they often change at depths different from the layers. See Moisture, consistency and density.
Show the line between layers
Each layer has a Boundary that the log sheet draws at its top:
| Boundary | Use it when |
|---|---|
| solid | The material changes. |
| dashed | The same material continues with a change, for example "From 2.6 m, grey". |
| gradational | One material changes slowly into the next. |
| termination | The hole stops here. |
| none | The log draws no line. |
The Boundary column is in the Field set of columns. Scroll the table to the right to see it.
Geology units
A geology unit names the formation of a layer, for example Alluvium or Residual soil. Units join the same layer across holes in sections and in the 3D view.
- In the Geology unit column, select a unit from the project's list.
- To change the list, open the project details. Find Geology units. Type the units, or copy them from another project.
To give many layers a unit at one time, click Data › Assign units.
Soil and rock in one table
Log the rock under the soil in the same Lithology table. On the log sheet, the rock layers print on the cored log, below the depth where coring starts. Record the core runs, strength, weathering and defects in their own tables. See Core, rock and defects.